Decisions backed by data you can trust.
From scattered spreadsheets to a single source of truth, we build dashboards, KPI reporting and data pipelines with senior, AI-augmented engineers who own delivery end to end.
- Single source of truth
- Real-time KPIs
- Self-serve analytics
 Single source of truth
Real-time KPIs
Self-serve analytics
Single source of truth
Real-time KPIs
Self-serve analytics
Every layer of your BI stack.
One senior team across the full analytics journey, from raw source to executive dashboard.
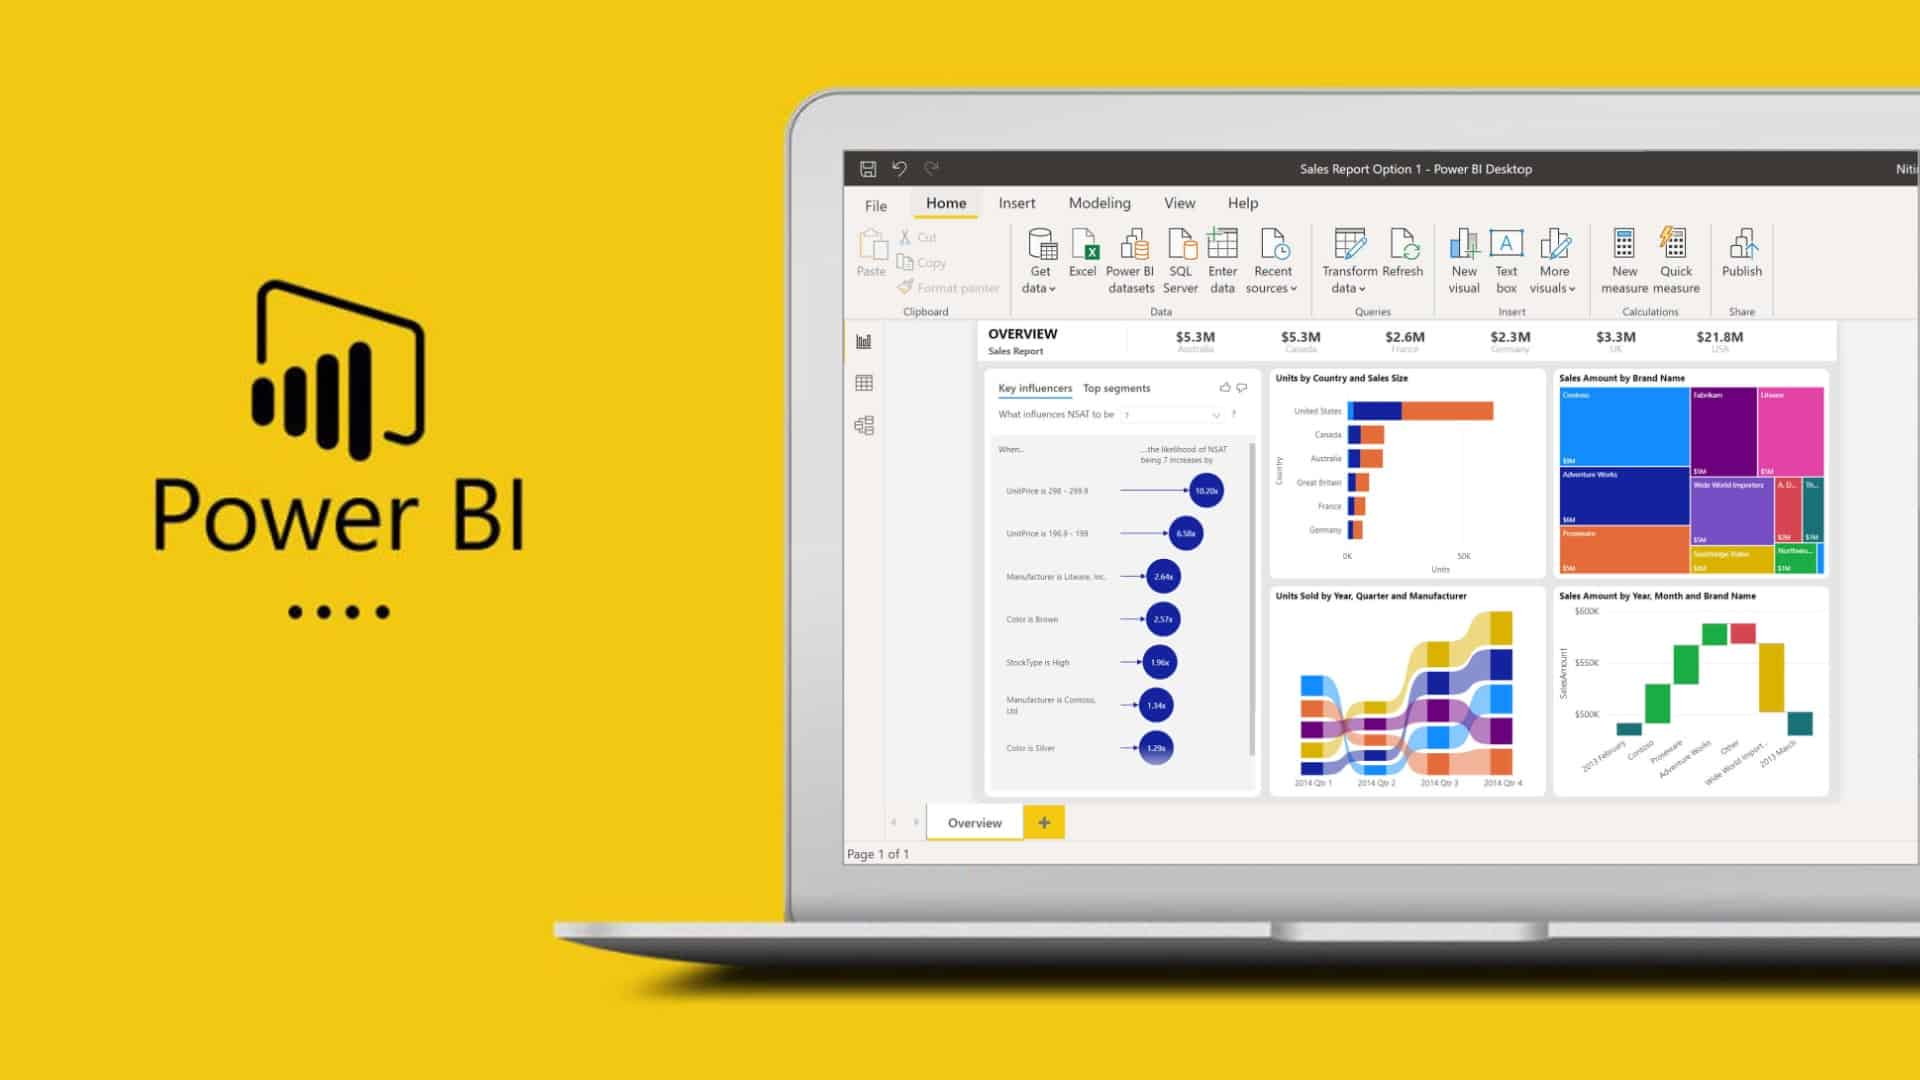
Interactive dashboards
Executive and team dashboards that surface the metrics that move your business.
KPI & reporting
Automated KPI reporting and scheduled exports that replace manual spreadsheet work.
Data pipelines & ETL
Reliable pipelines that ingest, clean and model data from every source you run.
Data warehouses
Modern cloud warehouses and semantic layers that give everyone consistent numbers.
Self-serve analytics
Governed self-service so teams answer their own questions without waiting on IT.
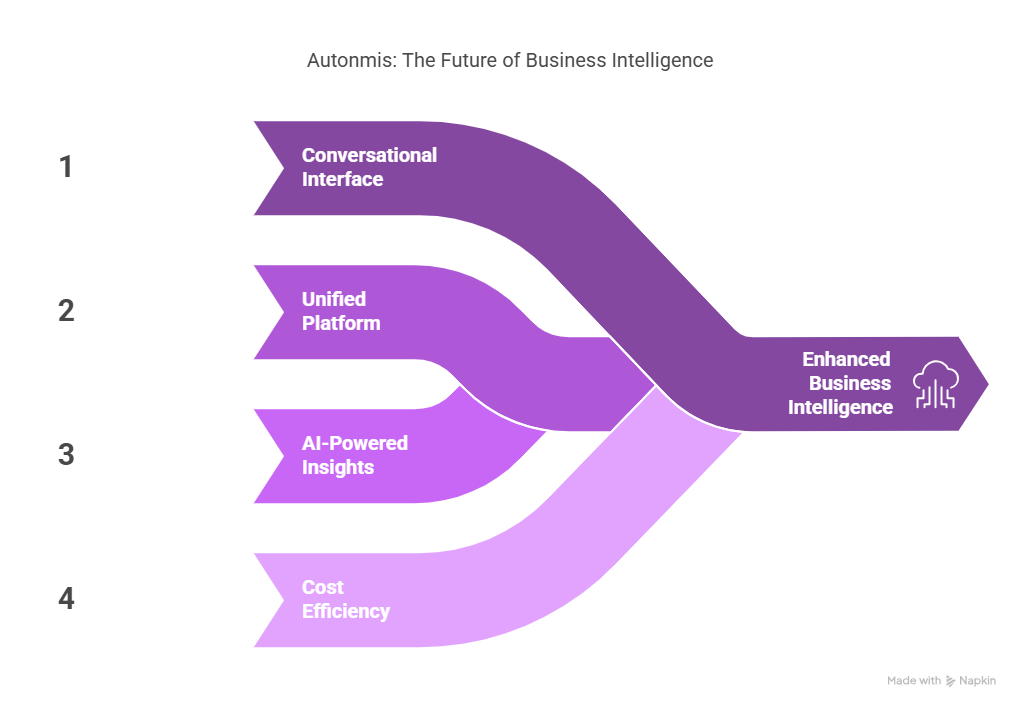
AI-powered insights
LLM-driven natural-language queries, forecasting and anomaly detection on your data.
How we deliver BI people actually use.
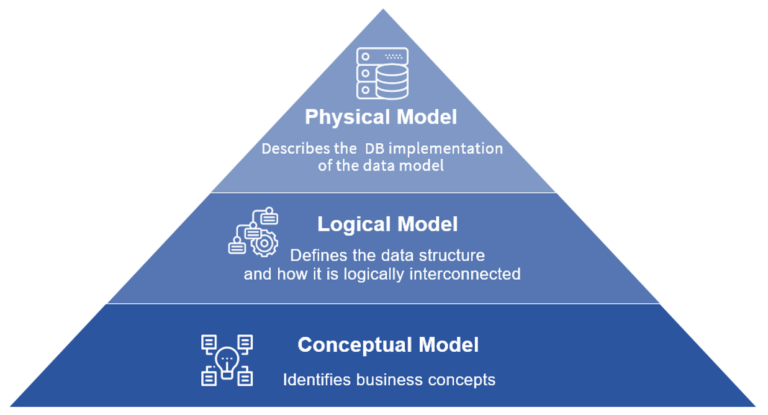
Model the data first
We map your sources, agree definitions and build a clean semantic layer up front, so a metric means the same thing in every report, not three different numbers.
Design for the decision
Every dashboard starts from the question it must answer. Clear visuals, fast filters and the right granularity, because insight unused is insight wasted.
Automate & trust
Tested pipelines, data quality checks and freshness alerts keep the numbers right, with AI-assisted review catching issues before stakeholders ever see them.
A modern, proven BI stack.
Business intelligence questions, answered.
How long until we see our first dashboard?
A first working dashboard on real data typically lands in 3–5 weeks; the full warehouse and reporting suite then grows in continuous sprints. We share a milestone plan after a short discovery call.
Can you connect our existing data sources?
Yes. We integrate ERPs, CRMs, databases, SaaS APIs and spreadsheets, then model them into one consistent semantic layer so every report agrees.
Which BI tool should we use?
It depends on your team and budget, we work across Power BI, Tableau, Looker and Metabase, and recommend the fit rather than pushing a single vendor. Your data and models stay portable.
How do you make sure the numbers are correct?
Centralised metric definitions, automated data quality tests, freshness alerts and AI-assisted review, plus transparent sprint reporting so you always trust what the dashboards show.
Ready to see your data clearly?
Tell us the decisions you need to make, we'll propose a data model, dashboards and a senior team to deliver them.