
Platform Engineering vs DevOps: Why Modern Enterprises Are Building Internal Platforms
Platform engineering vs DevOps: what internal developer platforms are, when to build a platform team, and the...
A practical DevOps maturity model and DORA metrics to assess where your engineering org stands today, plus a roadmap to level up.
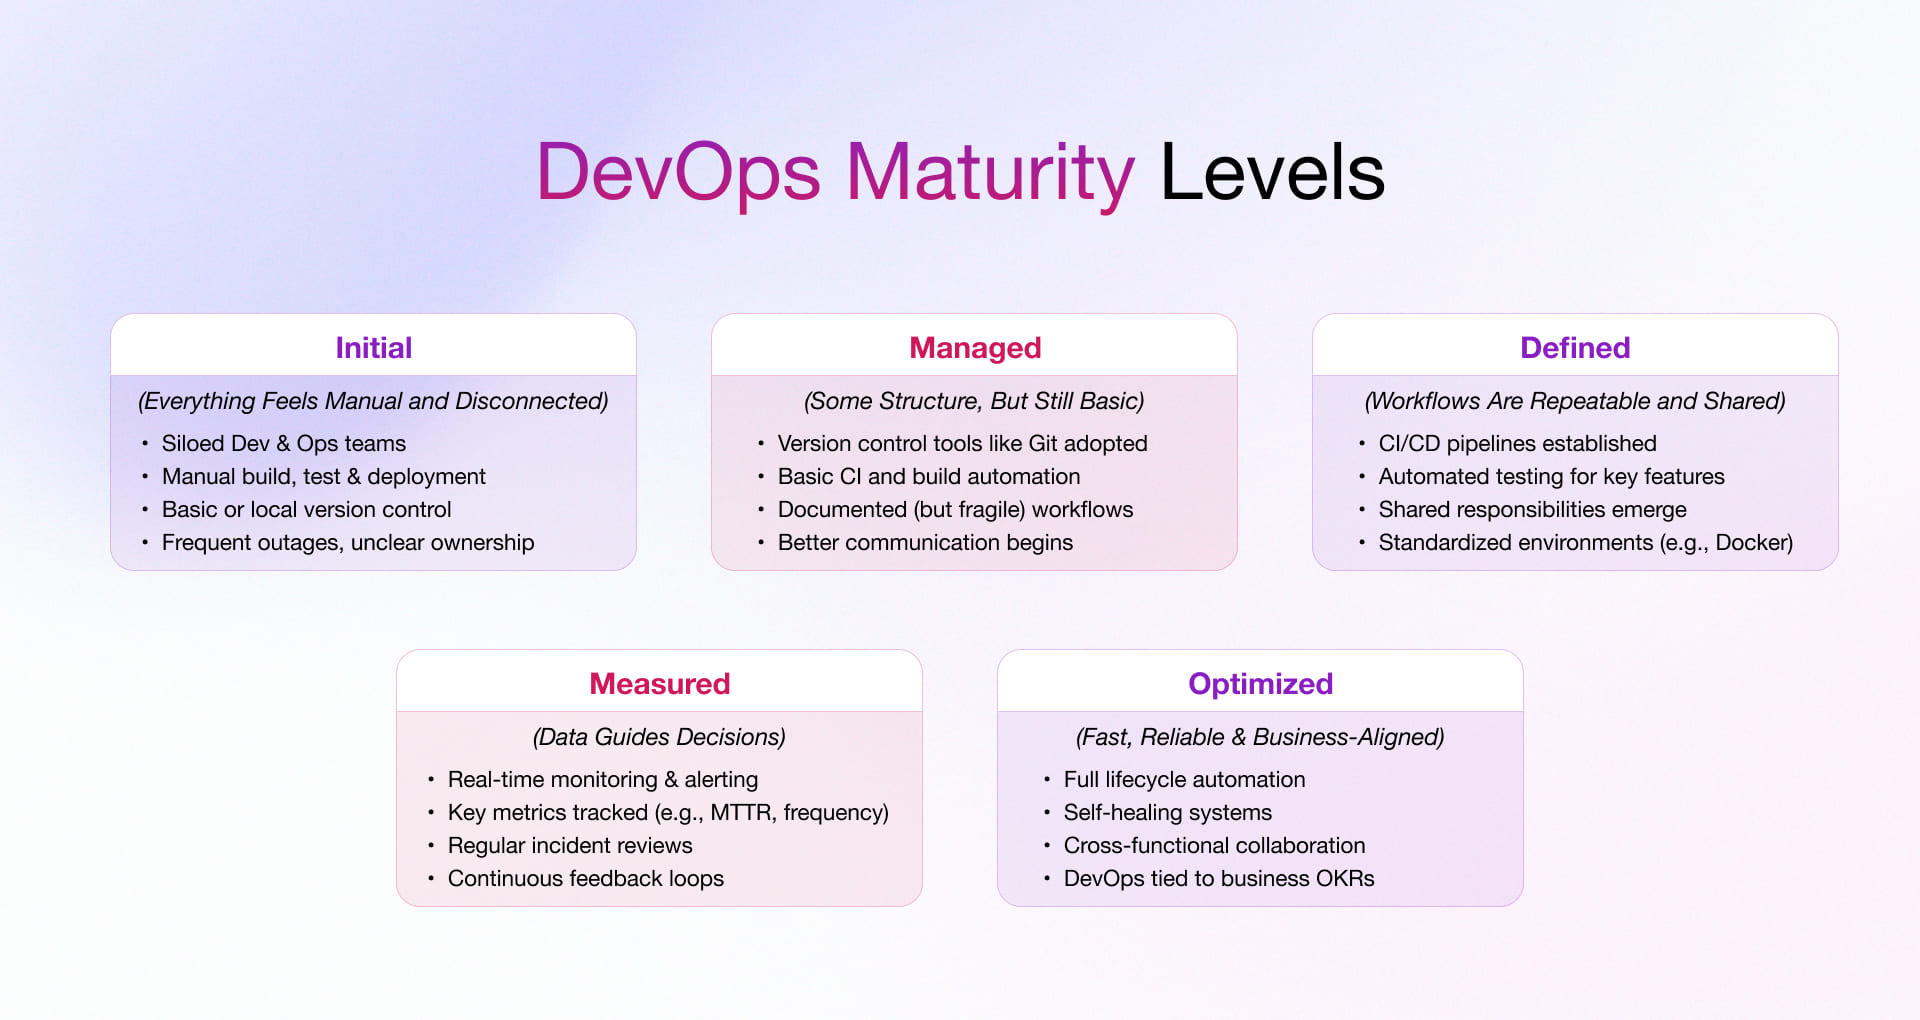
A DevOps maturity model is a structured framework that scores your engineering organization across five levels, from ad-hoc and manual to optimizing and self-improving, using objective signals like deployment frequency, lead time, change failure rate, and recovery speed. It tells you where you stand today, what good looks like next, and which constraint to fix first. Most teams overestimate their maturity by at least one full level because they measure intentions rather than outcomes.
This matters because the gap between high and low performers is enormous, not marginal. The DORA 2024 research found elite teams deploy 182 times more often and recover from failures 2,293 times faster than low performers [4]. That is not a productivity tweak. It is a different operating reality.
This guide gives you a concrete five-level DevOps maturity model, ties each level to the DORA four key metrics, shows you how to self-assess honestly, and lays out a phased roadmap to move up. If you want a second opinion on your assessment, teams like Mind Supernova help enterprises benchmark and modernize delivery pipelines. You can schedule a call with our engineering team to pressure-test your findings.
Key Takeaways
- The DORA four keys (deployment frequency, lead time for changes, change failure rate, and failed deployment recovery time) are the most defensible way to measure DevOps maturity, because they balance speed and stability.
- Elite performers deploy 182x more often, ship changes 127x faster, fail 8x less, and recover 2,293x faster than low performers, yet only about 19% of teams reach elite [4].
- Maturity is not linear tooling. Level 3 to Level 4 is mostly an organizational and platform problem, not a CI/CD tool problem.
- The 2024 AI paradox is real: roughly 76% of practitioners use AI daily, but each 25% rise in AI adoption correlated with about a 1.5% throughput drop and 7.2% stability drop without strong delivery foundations [4].
- Self-assessment fails when teams score aspirations. Measure the last 90 days of real production data, not the process you wish you followed.
DevOps stopped being a movement and became table stakes years ago. The CD Foundation reported that roughly 83% of developers do some form of DevOps, yet continuous integration usage sits near 29% and continuous delivery near 27%, and both have been slipping [5]. That gap between adopting the label and practicing the discipline is exactly what a maturity model exposes.
A maturity model does three useful things. It creates a shared vocabulary so a CTO, a VP of Engineering, and a platform lead argue about the same thing. It separates symptoms from constraints so you stop buying tools to fix culture problems. And it produces a baseline you can re-measure, which turns improvement into evidence rather than opinion.
The trap is treating maturity as a vanity score. The goal is not to reach Level 5 on a slide. The goal is to move the business outcomes that maturity correlates with: faster recovery, lower failure rates, and the ability to ship a fix to a customer before they escalate. Keep that framing and the model earns its keep.
Maturity does not exist in a vacuum. Your architecture sets a ceiling on how fast you can safely deploy, which is why the choice between a monolith, microservices, or a modular monolith is upstream of any maturity gain. We cover that decision in our guide to web application architecture in 2026. Above Level 3, most organizations discover that further gains require an internal platform, which is the subject of platform engineering versus DevOps.
Before the model itself, fix the measurement. The DORA program has spent more than a decade validating that four metrics predict both software delivery performance and organizational outcomes. Two measure throughput, two measure stability. You need all four, because optimizing one in isolation usually breaks another.
The 2024 DORA report quantified the spread between performance tiers, and the numbers are stark. Use this table as your reference baseline when you self-assess [4].
| DORA metric | Low performers | Elite performers | Elite advantage |
|---|---|---|---|
| Deployment frequency | Fewer than once per month | On-demand, multiple per day | 182x more deploys |
| Lead time for changes | One to six months | Less than one day | 127x faster |
| Change failure rate | High, frequent rollbacks | Low, rare remediation | 8x lower |
| Recovery from failure | Weeks to months | Under one hour | 2,293x faster |
| Share of teams | Significant tail | About 19% of teams | Elite is rare |
Notice what these metrics do not include. They say nothing about story points, lines of code, or how many tools you bought. That is deliberate. Maturity is an outcome you measure at the production boundary, not an activity you count inside the team.
The same DORA research surfaced an uncomfortable finding. Around 76% of practitioners now use AI in daily work, but adoption did not automatically improve delivery. Each 25% increase in AI adoption correlated with roughly a 1.5% reduction in throughput and a 7.2% reduction in stability [4]. AI amplifies whatever system it lands in. Drop it into a low-maturity pipeline with weak tests and slow review, and it generates more change for an organization that cannot safely absorb change. Maturity is the prerequisite, not the consequence, of getting value from AI in delivery.
Here is the model. Each level is defined by behaviors and by the DORA band it typically produces. Read it top to bottom and find the level where you actually live, not the one you are aiming for. Be honest: the model is only useful if the score is true.
| Level | Name | Defining behaviors | Typical DORA band | Primary constraint |
|---|---|---|---|---|
| 1 | Ad-hoc | Manual builds and deploys, hero-driven releases, no shared environments, tribal knowledge, deploys feared and batched. | Low | No automation or version discipline |
| 2 | Managed | Source control everywhere, scripted builds, a basic CI server, scheduled releases, some automated tests, manual approvals. | Low to medium | Slow, batched, manual gates |
| 3 | Defined | Automated CI/CD per service, trunk-based or short-lived branches, environments as code, automated test gates, observability in place. | Medium to high | Inconsistency across teams |
| 4 | Measured | DORA metrics tracked continuously, self-service platform with golden paths, progressive delivery, automated rollback, SLOs and error budgets. | High to elite | Scaling consistency, cognitive load |
| 5 | Optimizing | Continuous experimentation, chaos engineering, automated remediation, platform feedback loops, security and compliance shifted fully left. | Elite | Diminishing returns, sustaining culture |
Deploys happen by hand, often late at night, and one or two people hold the knowledge that makes them work. Environments drift because nobody codifies them. The dominant emotion around release day is anxiety, so changes get batched into large, risky drops. Recovery is slow because there is no clean rollback path. The fix here is not sophisticated: get everything in version control and script the build.
You have a CI server and most things are scripted, but the pipeline still bottlenecks at manual approvals and scheduled release windows. Tests exist but coverage is patchy and flaky tests are tolerated. This is where most enterprises actually sit, and it is a comfortable plateau because it feels modern without delivering elite outcomes. Breaking out means automating the gates you currently trust humans to perform.
Every service has its own automated CI/CD pipeline, branches are short-lived, environments are defined as code, and automated tests gate promotion. Observability exists so you can see what production is doing. The constraint shifts from technology to consistency: each team solved delivery slightly differently, and that variation now slows the whole organization. This is the inflection point where a platform team starts to pay off.
You track the DORA four keys continuously and treat them as a product metric. Teams ship through a self-service internal platform with paved golden paths. Progressive delivery, canaries, and automated rollback are normal. SLOs and error budgets govern the trade-off between speed and reliability. The work here is sustaining consistency at scale and managing developer cognitive load so the platform stays an enabler, not a bottleneck.
The system improves itself. Chaos engineering validates resilience before incidents happen, remediation is increasingly automated, and security and compliance checks run inside the pipeline rather than at a late gate. The risk at Level 5 is over-investment. The marginal cost of the next improvement can exceed its value, so the discipline becomes knowing when good enough is genuinely good enough.
Self-assessment is where most maturity exercises go wrong. Teams score the process they intend to follow, not the one production data reveals. Run the assessment against the last 90 days of real deployment history. If you cannot pull that data, your honest answer is Level 1 or Level 2, because measurement itself is a maturity signal.
Once you have a level, you need to know where to act. Apply this framework in order. It is deliberately a single chain, because fixing constraints out of order wastes money. Find your first "no" and start there.
START: Can you deploy on demand without a change-advisory meeting?
   |
   NO  -> Fix: automate the gate. Replace manual approval with automated
   |        tests and policy checks. (Level 1->2 / 2->3)
   |
   YES -> Is lead time under one day from commit to production?
            |
            NO  -> Fix: shorten the pipeline. Trunk-based development,
            |        smaller batches, parallel test stages. (Level 2->3)
            |
            YES -> Is change failure rate low and recovery under one hour?
                     |
                     NO  -> Fix: stability. Progressive delivery, automated
                     |        rollback, better observability. (Level 3->4)
                     |
                     YES -> Are all teams consistent on a self-service platform?
                              |
                              NO  -> Fix: build golden paths / IDP. (Level 4)
                              |
                              YES -> Optimize: chaos, auto-remediation,
                                       shift security fully left. (Level 5)
The framework forces sequence. You cannot meaningfully optimize stability if you still batch releases monthly, and you cannot scale a platform if individual teams have not yet automated their gates. Each "no" is your highest-leverage investment for the next quarter.
The single most important architectural decision in this model happens between Level 3 and Level 4. At Level 3 every team has automated delivery, but they all did it differently. Gartner projects that by 2026 roughly 80% of large software organizations will have platform teams, up from about 45% in 2022, precisely because this inconsistency becomes the binding constraint at scale [as reported by Gartner]. An internal developer platform with golden paths converts dozens of bespoke pipelines into one paved road.
Building a platform is a genuine trade-off, not a free win. Standardization speeds new teams and reduces operational surface, but it can frustrate senior engineers who lose flexibility. Autonomy keeps teams fast and motivated, but it produces the very inconsistency you are trying to remove. The mature answer is a paved road, not a walled garden: make the golden path the easiest option, allow exceptions with clear ownership, and measure adoption.
| Dimension | Full standardization (strict platform) | Full autonomy (team choice) | Paved road (recommended) |
|---|---|---|---|
| Onboarding speed | Fast | Slow | Fast |
| Operational surface | Small | Large | Small to medium |
| Engineer satisfaction | Risk of friction | High initially | High |
| Consistency of DORA metrics | High | Low | High |
| Innovation flexibility | Constrained | High | Balanced with exceptions |
The diagram below shows the maturity progression mapped to where automation and ownership shift. The key transition is the platform layer appearing between Defined and Measured.
L1 Ad-hoc    [ manual ]------------------------------> people own everything
L2 Managed   [ CI ][ manual gates ]-----------------> tooling owns build
L3 Defined   [ CI/CD per team ][ env as code ]------> teams own pipelines
                         |
                         v   PLATFORM INFLECTION POINT
L4 Measured  [ self-service platform / golden paths ]-> platform owns paved road
L5 Optimizing[ self-healing + chaos + shifted-left security ]-> system owns recovery
Consider the contrast the DORA data implies, grounded in widely documented practice. A low-maturity retailer batches releases into a monthly window, deploys manually, and when a payment bug ships, the team spends days reproducing it across drifted environments before a fix reaches customers. That is the 2,293x recovery gap made concrete [4].
Compare that with the documented practice at companies running mature continuous delivery, where Amazon famously deploys to production thousands of times per day through fully automated pipelines with automated rollback. When a change degrades a metric, the canary catches it and rolls back automatically, often before a human notices. The difference is not heroism. It is the system absorbing failure safely because progressive delivery and observability are built in.
The lesson for your organization is that elite recovery is an architectural property, not an effort level. You do not get under-one-hour recovery by trying harder. You get it by making rollback automatic, deployments small, and the blast radius of any single change tiny. That is what Level 4 and Level 5 buy you, and it is why the CI/CD design underneath matters so much. We go deep on that in our guide to building a CI/CD pipeline that scales across multiple teams and products.
Maturity gains compound, so sequence matters more than speed. Below is a phased roadmap. Treat each phase as roughly a quarter, but let your assessment, not the calendar, decide when to advance. Do not start a phase until the previous one is genuinely embedded.
If internal capacity is the constraint on moving through Phase 2 or Phase 3, an external partner can accelerate the build-out. Mind Supernova provides staff augmentation and dedicated teams of senior engineers who can start in five to seven days with 4+ hours of daily UK overlap, which is often the fastest way to stand up platform capability without pulling product engineers off the roadmap.
Most maturity efforts fail for predictable reasons. Watch for these, because each one quietly caps your level no matter how much you invest elsewhere.
Maturity costs money, and the costs change shape as you climb. Early levels are mostly engineering time to automate. Later levels add platform tooling, observability licensing, and the standing cost of a platform team. The table below gives indicative cost drivers by phase. Treat the figures as relative weight, not a quote.
| Phase | Dominant cost | Typical investment shape | Main risk if underfunded |
|---|---|---|---|
| Foundations (1 to 2) | Engineering time | Existing team, weeks of focused effort | Automation rots without ownership |
| Automation (2 to 3) | CI/CD and test tooling | Tooling spend plus test authoring time | Flaky tests erode trust in the pipeline |
| Platform (3 to 4) | Platform team plus tooling | Dedicated team, observability licensing | Platform becomes a bottleneck, not an enabler |
| Optimization (4 to 5) | Ongoing reliability investment | Standing platform plus SRE practice | Diminishing returns, over-engineering |
For the pipeline itself, buy. Managed CI/CD, observability, and feature-flag platforms are mature and rarely worth rebuilding. The defensible build is the thin layer on top: your golden paths, your service templates, and the opinionated developer experience that encodes how your organization ships software. That layer is where your delivery advantage lives, and it is too specific to outsource wholesale.
Recommendation: buy the commodity infrastructure, build the paved road on top, and consider augmenting your team to build that road faster. If you lack senior platform engineers in-house, partnering for the build-out is usually cheaper and faster than hiring, especially when you need capability within a quarter rather than two. Our guide to platform engineering versus DevOps covers how to staff and scope that team. For organizations adding AI to the delivery loop, the same discipline applies, and our take on AI-powered software development beyond coding assistants explains why foundations come before automation. If you are weighing an external partner, the checklist in how to choose an outsourcing partner without getting burned applies directly to platform and DevOps work too.
A DevOps maturity model is a framework that scores an engineering organization across levels, typically five, from ad-hoc and manual to optimizing and self-improving. It uses objective signals like the DORA four keys to identify where you stand, what good looks like next, and which constraint to fix first to improve delivery.
The DORA four keys are deployment frequency, lead time for changes, change failure rate, and failed deployment recovery time. Two measure throughput and two measure stability. Together they predict both software delivery performance and broader organizational outcomes, which is why they are the most defensible basis for assessing DevOps maturity [4].
Pull the last 90 days of real deployment and incident data, then score each stage of build, test, deploy, observe, and recover against the level table. Your true level is the lowest stage, not the average. If you cannot pull that data at all, you are likely at Level 1 or 2.
Not automatically. The DORA 2024 research found that each 25% increase in AI adoption correlated with roughly a 1.5% throughput drop and a 7.2% stability drop in teams without strong foundations [4]. AI amplifies the system it lands in, so maturity is the prerequisite for getting value from AI, not the reverse.
Buy the commodity infrastructure: managed CI/CD, observability, and feature-flag platforms are mature and rarely worth rebuilding. Build the thin opinionated layer on top, your golden paths and service templates, because that paved road encodes your delivery advantage and is too organization-specific to outsource wholesale.
A DevOps maturity model is only valuable if it changes what you do next quarter. The five levels give you a destination, the DORA four keys give you an honest measurement, and the decision framework tells you which single constraint to attack first. The gap between low and elite is too large to ignore: 182x more deploys and 2,293x faster recovery is a different competitive reality, not a rounding difference [4].
This quarter: pull your last 90 days of deployment and incident data, score yourself against the level table, and identify your first "no" in the decision framework. That is your highest-leverage investment.
Next 90 days: execute the matching roadmap phase, stand up a shared DORA dashboard, and re-measure. If you want an external benchmark or extra senior capacity to move faster, talk to our engineering team. Mind Supernova helps enterprises assess delivery maturity and build the platform layer that moves the numbers.
Platform engineering vs DevOps: what internal developer platforms are, when to build a platform team, and the...

How to design a CI/CD pipeline that scales across many teams and products: golden templates, security gates, m...

Cloud-native application development explained: containers, Kubernetes, and serverless, when each fits, and ho...