
Power BI vs Looker vs Tableau in 2026: Choosing the Right Analytics Platform
Power BI vs Looker vs Tableau in 2026: a deep comparison of cost, modeling, governance, and embedding, with be...
How to build a data-driven organization: a practical BI transformation roadmap across people, process, technology, and culture, with metrics.
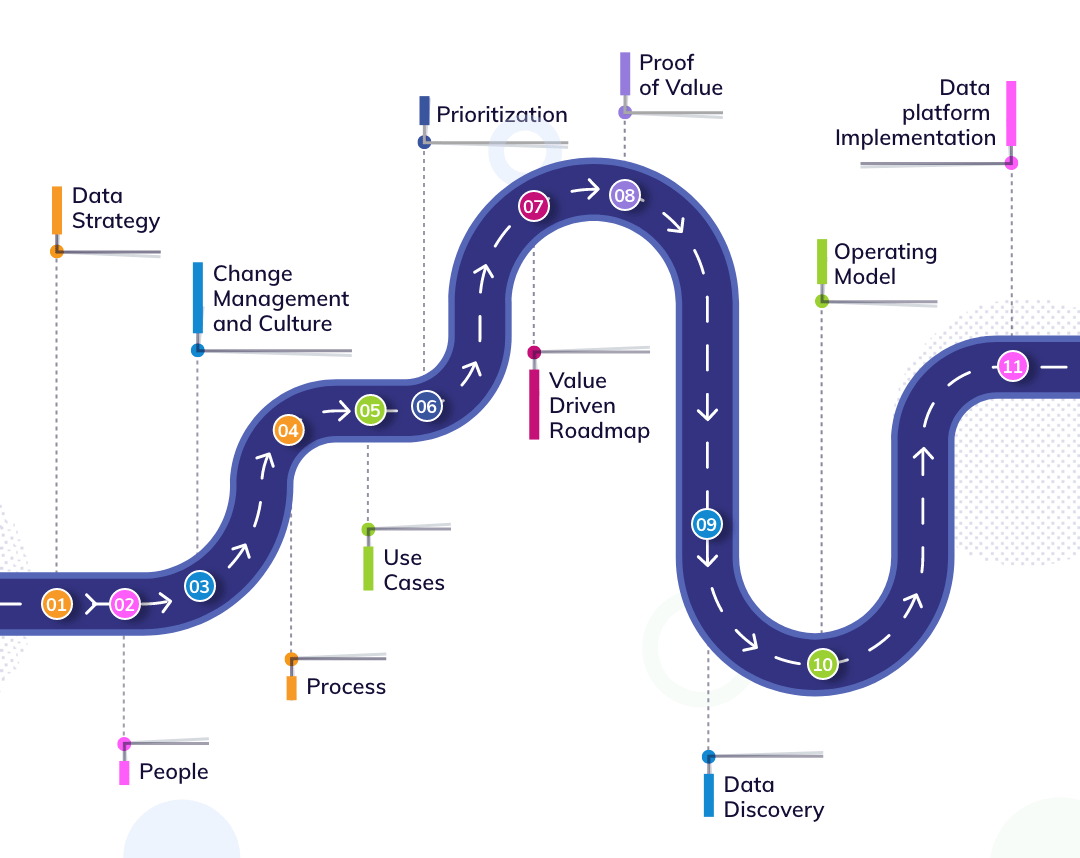
Building a data-driven organization means aligning four things at once: people, process, technology, and culture, so that decisions across the business are made with evidence rather than instinct. It is not a tooling project. The dashboards are the easy part. The hard part is changing how a CFO, a product lead, and a regional sales manager actually decide what to do on a Tuesday morning.
That gap shows up in the data. The Wavestone 2024 Data and AI Leadership Executive Survey found only about 48% of organizations describe themselves as data-driven, up from roughly 24% a few years earlier [5]. Self-reported, yes, and even that modest number means more than half of large enterprises still run on gut feel. A BI transformation closes that gap deliberately, in phases, with metrics attached to each one.
This roadmap is written for CIOs, CTOs, heads of data, and product leaders who already have some business intelligence in place and want to move from scattered reports to genuine decision discipline. We cover a maturity model you can score yourself against, the operating model that holds it together, the phased plan, the costs, the build-versus-buy decision, and the mistakes that quietly kill these programs. Teams like Mind Supernova, a Vietnam-based software engineering partner founded in 2023, help enterprises stand up the data engineering and platform work underneath all of this, so we will be specific about what to build versus buy. If you want to pressure-test your own plan, you can talk to our engineering team directly.
Key Takeaways
- Data-driven transformation fails as a tech project and succeeds as a behavior-change program: roughly 48% of firms call themselves data-driven (Wavestone 2024), and the difference is culture and process, not tooling [5].
- Use a 5-level maturity model to score people, process, technology, and culture separately. Most enterprises sit at Level 2 (siloed reporting) and stall there because they invest only in technology.
- Run the program in four phases over 12 to 24 months: foundation, governed self-service, embedded decisions, and continuous optimization. Attach a hard metric to each phase.
- Budget realistically: a mid-market BI transformation typically runs $250K to $1.2M in year one (industry estimate), dominated by people and change management, not licenses.
- Buy the BI platform and warehouse, build the semantic layer, pipelines, and governance that encode your business. Measure success by decision latency and trust, not dashboard count.
A data-driven organization is one where the default way to answer a business question is to look at trustworthy data, and where the people who own decisions can get that data without filing a ticket. The emphasis is on default and trustworthy. Plenty of companies have data and even good dashboards, yet leaders still override the numbers with a hunch, or the numbers are different in every meeting.
It helps to separate three capabilities that often get blurred together. Reporting tells you what happened. Analytics tells you why it happened and what is likely next. Decision intelligence connects an insight to an action and a measured outcome. A data-driven organization does all three, but it is the third that creates value, and it is the one most transformation programs forget to design for.
If you only fund technology, you build a fast car with no driver. The Wavestone finding that under half of firms call themselves data-driven, despite a decade of heavy BI spending, is the clearest evidence that the missing ingredients are people, process, and culture [5].
Before you plan a transformation, score where you are. Assess each of the four pillars independently, because most organizations are uneven. A common profile is Level 3 technology sitting on Level 1 culture, which is why the expensive platform never gets used. Rate each pillar 1 to 5, then take the lowest as your effective maturity, since the weakest pillar caps the whole system.
| Level | Name | People | Process | Technology | Culture | Typical symptom |
|---|---|---|---|---|---|---|
| 1 | Reactive | Analysts in IT only; business has none | Ad hoc, ticket-driven | Spreadsheets, manual exports | Decisions by seniority | "Send me the numbers" emails |
| 2 | Siloed | Departmental analysts, no shared skills | Each team defines its own metrics | Departmental BI, multiple sources of truth | Data used to defend, not decide | "My revenue number disagrees with yours" |
| 3 | Centralized | Central data team; business depends on it | Governed definitions, request backlog | Single warehouse, certified dashboards | Leaders ask for data, slowly | "The data team is the bottleneck" |
| 4 | Self-service | Embedded analysts plus literate business users | Governed self-service, clear ownership | Semantic layer, self-service BI | Data expected in every decision | "Teams answer their own questions" |
| 5 | Optimized | Data fluency org-wide; analytics engineering discipline | Continuous experimentation, decision logs | Real-time pipelines, ML in production | Comfortable being proven wrong by data | "We test, measure, and adjust by default" |
Be honest in the scoring. The number that matters is the lowest pillar, not the average. An organization with world-class technology (5) and a defend-the-turf culture (2) behaves like a Level 2 organization, because no one trusts or acts on the output. Most enterprises we see cluster at Level 2 on at least one pillar, and that is exactly where the 48% figure comes from: enough investment to have data, not enough alignment to be driven by it [5].
Keep it light. A two-week exercise beats a three-month consulting audit. Interview eight to twelve decision-makers across functions, sample twenty recent decisions, and ask one question: what evidence did you use, and could you have gotten it yourself? Then map the answers to the model. The decisions tell the truth that the architecture diagrams hide.
Technology choices are reversible. Operating model mistakes calcify. Decide early who owns metrics, how self-service is governed, and where analytics talent sits, because these shape everything downstream.
Three patterns dominate, and the right one depends on your maturity. A fully centralized team works at Level 2 to 3, when you need to establish a single source of truth and cannot yet trust distributed analysts. A hub-and-spoke model, where a central platform team sets standards and embedded analysts sit inside business units, is the sweet spot for Level 4. Fully federated ownership, common in data mesh designs, only works at Level 5 when data literacy is genuinely org-wide.
The single highest-leverage process decision is naming an owner for every core metric and encoding its definition once, in a semantic layer, so every dashboard inherits the same logic. When "active customer" means three different things in three reports, no amount of dashboard polish will rebuild trust. The semantic layer is where governance and self-service meet, which is why it is the one piece we almost always recommend building rather than buying outright.
Data-driven behavior is a habit, and habits live in recurring meetings. Install a small number of rituals: a weekly business review reading from certified metrics, an experiment readout cadence, and a decision log that records the call, the evidence, and the predicted outcome. Reviewing those predictions later is what builds a culture comfortable with being wrong, which is the marker of Level 5.
The technology stack for a modern data-driven organization is well established. The shape matters more than the brand names. Data flows from sources through ingestion into a warehouse or lakehouse, is transformed into governed models, exposed through a semantic layer, and consumed by BI tools, embedded analytics, and increasingly AI assistants. For deeper architecture choices at the storage layer, see our companion piece on modern BI architecture from data warehouses to self-service analytics.
 SOURCES                INGESTION            STORAGE              MODELING            CONSUMPTION
 +-----------+          +-----------+        +-------------+      +-----------+       +--------------+
 | SaaS apps |          | Batch ELT |        | Warehouse / |      | Transform |       | BI dashboards|
 | Databases | -------> | CDC       | -----> | Lakehouse   | ---> | (dbt)     | --+--> | Self-service |
 | Events    |          | Streaming |        | (governed)  |      | Semantic  |   |   | Embedded     |
 | Files     |          +-----------+        +-------------+      | layer     |   |   | AI / NL query|
 +-----------+               |                      |             +-----------+   |   +--------------+
                             |                      |                   |         |
                        +----------------------------------------------------------------+
                        | GOVERNANCE: catalog, lineage, access control, quality tests     |
                        +----------------------------------------------------------------+
Two design notes. First, the governance plane spans the whole pipeline rather than bolting on at the end; cataloguing and lineage retrofitted late are painful. Second, the semantic layer is the contract between engineering and the business. Get it right and self-service becomes safe; skip it and self-service becomes chaos. For real-time use cases that sit alongside this batch-first design, our guide to building a real-time data pipeline for enterprise scale covers the streaming path in depth, and the broader storage trade-offs draw on patterns from modern data platforms for AI-driven organizations.
The recurring failure is investing in the wrong pillar for your maturity level. A simple decision framework prevents that. Find your lowest-scoring pillar, then pick the move that raises it, rather than the move that is easiest to buy.
| If your lowest pillar is... | And you are at Level... | Do this first | Do NOT do this yet |
|---|---|---|---|
| Technology | 1 to 2 | Consolidate to one warehouse and one certified BI tool | Buy a real-time streaming stack |
| Process | 2 to 3 | Assign metric owners; build a semantic layer; define governance | Roll out self-service to everyone |
| People | 2 to 4 | Data literacy program; embed analysts in business units | Hire a data science team for ML |
| Culture | Any | Install decision rituals; get executives reading from certified metrics | Launch a flashy "data strategy" comms campaign |
| Balanced at 4 | 4 | Add experimentation, predictive models, real-time where it pays | Mandate AI features no one asked for |
Every choice in this program has a cost on the other side. Naming them upfront keeps the program honest.
Run the transformation in four phases over 12 to 24 months. Each phase has a goal, a deliverable, and a single headline metric. Do not start a phase until the prior phase's metric is met, because skipping ahead is how Level 2 organizations buy Level 4 tools and stay at Level 2.
| Phase | Timeline | Goal | Key deliverables | Headline metric |
|---|---|---|---|---|
| 1. Foundation | Months 0 to 4 | One source of truth | Warehouse consolidation, top 10 certified metrics, governance charter, metric owners named | 0 metric definition conflicts in exec reviews |
| 2. Governed self-service | Months 4 to 9 | Reduce the request backlog | Semantic layer, self-service BI rollout, data literacy training cohort 1 | 60% of routine questions answered without a ticket |
| 3. Embedded decisions | Months 9 to 16 | Data in the workflow | Decision rituals live, experiment framework, embedded analytics in operational tools | Decision latency cut by half on tracked decisions |
| 4. Continuous optimization | Months 16 to 24+ | Predict and adapt | Predictive models, A/B at scale, real-time where it pays, AI-assisted querying | Measurable lift on 3+ business KPIs tied to data products |
Vanity metrics (dashboard count, data volume, license seats) tell you nothing about whether decisions improved. Track these instead:
This program does not end at AI, but it does set the foundation for it. A clean semantic layer and governed metrics are precisely what AI assistants and natural-language querying need to be reliable, which is why this roadmap pairs naturally with an enterprise AI transformation roadmap from pilot to enterprise scale.
Consider a composite mid-market financial services firm, drawn from common patterns rather than a single named client. It had six departmental BI deployments, three competing definitions of "active account," and an executive team that distrusted every number because the numbers never agreed. Technology maturity was Level 3. Culture and process were Level 2. The effective maturity was Level 2, and the symptom was meetings spent arguing about whose spreadsheet was right.
The fix did not start with a new tool. Phase 1 consolidated reporting into the existing warehouse, named owners for the ten metrics that appeared in board materials, and certified single definitions. The headline result was that the next quarterly review had zero definition disputes, which rebuilt enough executive trust to fund Phase 2. Phase 2 added a semantic layer and trained the first literacy cohort, and the data team's ticket backlog fell sharply as managers answered their own routine questions.
The instructive part is what did not happen. There was no big-bang platform migration, no data science hiring spree before the foundation was solid, and no real-time streaming bought for decisions that were made weekly. The pattern that consistently works is sequencing by maturity, and the pattern that consistently fails is buying capability the organization is not ready to use. This mirrors broader lessons from enterprise transformation programs, where pilots succeed and scale-ups stall for organizational, not technical, reasons.
Most BI transformations do not fail loudly. They stall. Watch for these.
Costs vary widely with scale and existing estate, so treat the figures below as industry estimates for a mid-market enterprise (500 to 2,000 employees) in year one, not quotes. The headline point is that people and change management usually outweigh software, which is the opposite of how most budgets are first drafted.
| Cost category | Indicative range (year 1) | Notes |
|---|---|---|
| BI platform licenses | $30K–150K | Per-user pricing scales with rollout; often the smallest line |
| Warehouse / lakehouse compute and storage | $40K–200K | Consumption-based; governable with good modeling |
| Data engineering and analytics build | $120K–500K | Pipelines, semantic layer, governance; the core spend |
| Change management and training | $40K–250K | Literacy, rituals, comms; the most under-budgeted line |
| Ongoing run (annualized) | $60K–300K | Platform team, support, iteration |
Total year-one outlay commonly lands between $250K and $1.2M (industry estimate). The cost lever most teams miss is warehouse compute: poor modeling and uncontrolled self-service queries can multiply the storage and compute bill, which is another argument for the semantic layer and certified models. Engaging a focused data engineering partner for the build phase, whether through staff augmentation or a dedicated team, often costs less than a slow internal ramp, because the foundation phase rewards speed and experience.
The clean rule: buy the commodity layers, build the parts that encode your specific business. Nobody should be writing their own BI rendering engine or columnar query engine in 2026. Equally, nobody should outsource the definition of their own core metrics to a vendor template.
| Layer | Recommendation | Why |
|---|---|---|
| BI / visualization tool | Buy | Commodity, mature; compare options before committing |
| Warehouse / lakehouse | Buy (managed) | Operationally heavy; managed services are mature and cost-effective |
| Ingestion / connectors | Buy standard, build custom | Buy for common SaaS sources; build for proprietary systems |
| Transformation and data models | Build | This is your business logic; it must live in your control |
| Semantic layer / metric definitions | Build | The single source of truth; the heart of governed self-service |
| Governance, lineage, catalog | Buy + configure | Tools exist; the policies and ownership are yours to define |
For the BI tool itself, do not pick on brand familiarity. The capabilities (modeling, governance, embedding, total cost) differ enough to matter, and we compare the leaders in Power BI vs Looker vs Tableau in 2026. On the build side, the transformation models, semantic layer, and pipelines are where a data engineering partner adds the most value, since they are skill-intensive and central to trust. This is the natural fit for teams like Mind Supernova: senior engineers who can start in 5 to 7 days, work async-first with 4+ hours of daily UK overlap, and build the governed foundation rather than just configure a dashboard. You can also engage on a software outsourcing basis for a defined build scope.
Plan for 12 to 24 months to move up two maturity levels, depending on your starting point and executive commitment. The foundation phase takes about four months. Culture change is the slowest variable. Tooling can be installed in weeks, but trusted, habitual data use takes quarters of consistent rituals and leadership behavior.
Business intelligence is the technology and reports that surface data. Being data-driven is the organizational behavior of defaulting to that data when making decisions. You can have excellent BI and still not be data-driven if leaders override the numbers with instinct. The Wavestone 2024 survey shows this gap clearly: only about 48% call themselves data-driven [5].
Not always, but you need someone senior and accountable for the program across all four pillars. At smaller scale a head of data or a sponsoring CIO can fill the role. What matters is one owner with authority over metric definitions, governance, and the literacy program, not the specific title on the org chart.
Buy the commodity layers (BI tool, managed warehouse, governance tooling) and build the parts that encode your business: transformation logic, the semantic layer, and custom pipelines. Building a query engine wastes effort; outsourcing your metric definitions to a template erodes trust. Most successful programs blend bought infrastructure with built business logic.
Track decision latency, the trust score (leaders acting on certified metrics without re-checking), self-service ratio, and decision-outcome accuracy from a decision log. Avoid vanity metrics like dashboard count or data volume. The clearest signal is when business teams answer their own routine questions and executives stop arguing about whose number is correct.
Becoming data-driven is a behavior-change program wearing a technology costume. The maturity model tells you where you are, the four pillars tell you what to fix, and the phased roadmap tells you the order. The organizations stuck below the 48% line are almost never short on tools. They are short on metric ownership, governed self-service, decision rituals, and executive habit [5].
This quarter: score your four pillars honestly, name owners for your top ten metrics, and certify single definitions so the next executive review has zero definition disputes. Next 90 days: stand up or refactor your semantic layer, pilot governed self-service with one literate business unit, and start a decision log to make trust measurable.
If you want help building the governed foundation, the pipelines, the semantic layer, and the data models that the BI tool sits on top of, that is exactly the work a focused data engineering partner accelerates. Schedule a call with our engineering team to pressure-test your roadmap and decide what to build versus buy.
Power BI vs Looker vs Tableau in 2026: a deep comparison of cost, modeling, governance, and embedding, with be...

Big data architecture in 2026: Lambda vs Kappa vs lakehouse compared, with streaming trade-offs and a clear de...

How to build a real-time data pipeline at enterprise scale: Kafka, Flink, CDC, exactly-once, schema management...