
How to Build a Real-Time Data Pipeline for Enterprise Scale
How to build a real-time data pipeline at enterprise scale: Kafka, Flink, CDC, exactly-once, schema management...
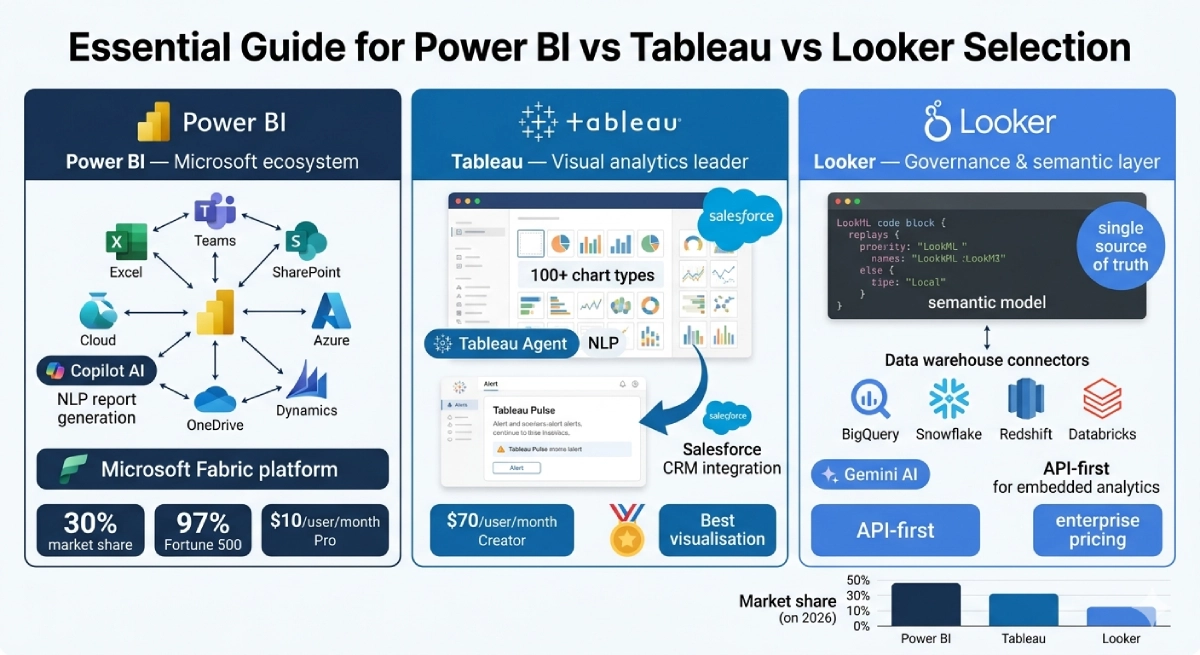
Power BI vs Looker vs Tableau in 2026: a deep comparison of cost, modeling, governance, and embedding, with best-fit recommendations.
For most enterprises in 2026, the right analytics platform is the one that fits your existing data stack and governance model, not the one with the best chart gallery. Power BI wins on cost and Microsoft integration, Looker wins on governed metric consistency through its semantic layer, and Tableau wins on depth of visual exploration. The hard part is matching that choice to how your organization actually models data, controls access, and embeds analytics into products.
If you are a CIO or head of data choosing between Power BI, Looker, and Tableau, you are not really comparing dashboards. You are comparing total cost of ownership over three to five years, the semantic modeling philosophy your analysts will live inside, and the governance posture your security team will sign off on. Get that framing wrong and you pay for it every quarter.
This guide breaks down all three platforms across cost, modeling and the semantic layer, governance, and embedding. It gives you a decision framework, a real migration example, a phased roadmap, the mistakes that quietly drain budgets, and an honest build-vs-buy view. If you want a second opinion on your specific stack, our engineering team is happy to talk it through.
Key Takeaways
- Power BI is the lowest-cost entry at roughly $10–20 per user per month for Pro and Premium Per User, and it is the default for Microsoft and Azure shops.
- Looker's strength is LookML, a centralized semantic layer that enforces one definition of every metric, which matters most when many teams query the same warehouse.
- Tableau leads on interactive visual analysis and analyst-driven exploration, but its per-creator licensing and Salesforce ownership shape the total cost.
- Gartner's 2024 Magic Quadrant ranks all three as Leaders by position, not by market share, so treat quadrant placement as a signal of vision and execution rather than proof of fit.
- Choose by data stack, governance model, and embedding needs first; the visualization experience is the tie-breaker, not the primary criterion.
Every analytics evaluation starts the same way. Someone builds three demo dashboards, the prettiest one wins, and eighteen months later the data team is fighting metric drift, license overruns, and a governance gap nobody priced in. The visual layer is the part you see, but it is the least durable part of the decision.
What actually determines success is the fit between the platform and three things you already own: your data warehouse, your identity and access model, and your appetite for centralized versus self-service analytics. A platform that queries Snowflake or BigQuery natively behaves very differently from one that imports extracts into an in-memory engine. A platform that respects row-level security from your warehouse saves your security team months of work.
Gartner's 2024 Magic Quadrant for Analytics and BI Platforms places Power BI, Tableau, and Looker among the Leaders, alongside Qlik and ThoughtSpot [1]. Read that placement as a measure of completeness of vision and ability to execute, not as market share or a ranking of which tool is objectively best. The quadrant tells you these are safe, mature choices. It does not tell you which one fits your warehouse, your team, or your budget.
So the order of evaluation matters. Start with the stack and the governance model. The chart gallery comes last.
Here is the head-to-head across the four dimensions that drive the decision. Treat the pricing as public list-price guidance; enterprise agreements, capacity-based tiers, and negotiated discounts shift real numbers significantly. Label any cost figure you take from this as an estimate.
| Dimension | Power BI | Looker | Tableau |
|---|---|---|---|
| Owner | Microsoft | Google Cloud | Salesforce |
| List pricing (estimate) | Pro ~$10/user/mo; Premium Per User ~$20; Fabric capacity (F-SKUs) for scale | Platform and per-user pricing, typically custom enterprise contracts; generally the highest entry point | Creator ~$75/user/mo, Explorer ~$42, Viewer ~$15; Tableau+ bundles higher |
| Modeling / semantic layer | Power BI semantic models (formerly datasets), DAX, star schema in the model | LookML: code-defined, version-controlled, centralized semantic layer | Per-workbook data models plus Tableau published data sources; semantic layer is lighter |
| Query mode | Import (VertiPaq in-memory) or DirectQuery to source | In-database: pushes SQL down to the warehouse | Extracts (Hyper engine) or live connection |
| Governance | Microsoft Purview, sensitivity labels, Entra ID, RLS in the model | Strong: central LookML enforces metric definitions and access; in-DB respects warehouse permissions | Tableau Cloud/Server permissions, data source certification, row-level security |
| Embedding | Power BI Embedded (Azure capacity), strong for ISVs on Azure | Excellent embedded analytics API, designed for product embedding | Tableau Embedding API and Embedded Analytics; capable but licensing-sensitive |
| Best-fit data stack | Microsoft / Azure / Fabric, SQL Server, Excel-heavy orgs | Cloud warehouses (BigQuery, Snowflake, Redshift) | Mixed and heterogeneous sources, analyst-led teams |
| Primary strength | Cost and Microsoft integration | Governed, consistent metrics at scale | Visual exploration depth and analyst flexibility |
Power BI almost always shows the lowest sticker price. Pro licenses are inexpensive, and many enterprises already hold them inside Microsoft 365 E5 agreements, which makes the marginal cost feel close to zero. The real spend appears when you move to Premium capacity or Microsoft Fabric F-SKUs for larger workloads, where you pay for reserved compute rather than per seat.
Tableau prices per role, and the Creator seat is the expensive one. A team of 30 creators and 300 viewers calculates very differently from 300 creators. Looker typically lands as the highest entry point because it is sold as a platform with custom enterprise contracts, and it assumes you already run a cloud data warehouse whose query costs you also pay. That warehouse compute is a hidden line item across all three when you run live or in-database queries.
The honest summary: Power BI is cheapest to start, Tableau costs scale with the number of content creators, and Looker carries the highest platform floor but can be the most cost-predictable at large scale because it pushes compute to a warehouse you already manage.
This is the dimension most buyers underweight, and it is the one that decides whether "revenue" means the same thing in every report a year from now.
Looker's LookML is the strongest semantic layer of the three. You define dimensions, measures, and joins once, in version-controlled code, and every Look and dashboard inherits those definitions. When finance changes the definition of churn, you change it in one place. That central control is Looker's whole reason for existing, and it is why governed organizations love it.
Power BI semantic models (the artifacts formerly called datasets) are powerful and reusable, built on DAX and a star schema you design inside the model. A well-run Power BI estate uses shared, certified semantic models that many reports connect to, which gives you most of Looker's consistency benefit if you enforce the discipline. The risk is sprawl: nothing stops an analyst from importing their own extract and inventing a new metric.
Tableau historically modeled data per workbook, which is flexible and fast for exploration but weaker for enterprise consistency. Published data sources and certification features close some of that gap, and Tableau's semantic model has matured, but the platform's center of gravity is still analyst-led exploration rather than central definition. If your priority is one governed truth, Looker leads, Power BI follows with discipline, and Tableau requires the most process to lock down.
Governance splits into two questions: access control (who can see which rows and reports) and definitional control (who owns what a number means). The platforms differ on both.
Power BI inherits the Microsoft governance stack: Entra ID for identity, Microsoft Purview for cataloging and lineage, sensitivity labels that travel with exported files, and row-level security defined in the model. For organizations already standardized on Microsoft, this is a major advantage because the controls are familiar and centrally administered.
Looker governs through LookML and in-database queries. Because Looker pushes SQL to the warehouse, it can respect the permissions and row-level security you already configured in Snowflake or BigQuery, and the semantic layer enforces definitional consistency by design. Tableau offers mature object-level permissions, data source certification, and row-level security, but more of the governance burden sits with how your team configures and maintains it. For a deeper view of where governance lives in the wider stack, see our companion piece on modern BI architecture from data warehouses to self-service analytics.
If you are an ISV or you embed dashboards into a customer-facing portal, embedding moves from a nice-to-have to a primary criterion. All three support it, with different shapes.
Looker was built with embedding in mind and offers a clean embedded analytics API, which makes it a strong pick for product teams putting governed analytics in front of external users. Power BI Embedded runs on Azure capacity and is the natural choice if your product already lives on Azure, with per-capacity pricing that suits multi-tenant apps. Tableau's Embedding API is capable and visually rich, but licensing for embedded external users needs careful modeling so costs do not surprise you at scale. Multi-tenant embedding also raises the same isolation questions covered in our guide to multi-tenant SaaS platform architecture.
Strip away the feature lists and each platform has a clear center of gravity. Use these as starting hypotheses, then validate against your own stack.
Demos do not decide platforms; weighted criteria do. The framework below scores each platform against the factors that actually predict a good outcome. Weight the rows to match your context, score each platform 1 to 5, and multiply.
| Decision factor | Weight (example) | Key question |
|---|---|---|
| Data stack fit | 25% | Does the platform query your warehouse natively, or copy extracts? |
| Semantic / modeling needs | 20% | Do you need one central, governed metric layer, or flexible per-team models? |
| Governance and security | 20% | Will it inherit your identity, lineage, and row-level security with minimal custom work? |
| Total cost of ownership (3 yr) | 15% | Licenses plus capacity plus warehouse compute plus admin effort, not sticker price. |
| Embedding requirements | 10% | Do you embed analytics in a product or external portal, and at what user scale? |
| Skills and adoption | 10% | Does your team think in DAX, SQL, or visual drag-and-drop today? |
If your highest weights land on data stack fit and you live in Microsoft and Azure, Power BI usually wins before you finish scoring. If governance and semantic consistency dominate and you run a cloud warehouse, Looker tends to pull ahead. If skills and exploration depth carry the most weight and your analysts are the heroes of your data culture, Tableau leads. Where two platforms tie, let embedding needs and three-year TCO break it.
DECISION FLOW: which analytics platform?

  Start
    |
    v
  Are you standardized on Microsoft 365 / Azure / Fabric? --yes--> Power BI (validate TCO)
    | no
    v
  Is a single governed metric layer across many teams the
  top priority, on a cloud warehouse?                      --yes--> Looker (validate platform cost)
    | no
    v
  Is deep analyst-led visual exploration the core need?    --yes--> Tableau (validate creator-seat cost)
    | no
    v
  Tie-breaker: score embedding needs + 3-year TCO,
  run a 2-week paid proof of concept on real data.
Every platform is a set of trade-offs. Naming them honestly is more useful than another feature checklist.
| Platform | You gain | You give up |
|---|---|---|
| Power BI | Low entry cost, deep Microsoft integration, broad reach | Governance discipline must be enforced manually; semantic-model sprawl if ungoverned; best value is tied to the Microsoft ecosystem |
| Looker | Centralized, version-controlled metrics; in-database governance; clean embedding | Higher platform floor; steeper LookML learning curve; warehouse query cost is yours to manage |
| Tableau | Best visual exploration; analyst flexibility; mature community | Per-creator cost scales fast; weaker central semantic layer by default; more governance configuration effort |
Notice the pattern. Power BI trades governance certainty for cost and reach. Looker trades flexibility and price for consistency. Tableau trades central control and predictable cost for exploration power. There is no free option, only the trade-off that hurts your organization least.
Consider a common 2026 pattern rather than a single named customer, because the shape repeats across mid-market and enterprise data teams. A retail and ecommerce group runs three regions, and over five years each region adopted a different tool: one bought Tableau for its merchandising analysts, one rolled out Power BI through its Microsoft agreement, and the newest region stood up Looker on top of BigQuery.
The symptoms were predictable. Group revenue reported three slightly different numbers depending on which dashboard you opened, because each tool modeled returns and currency conversion differently. Licensing was triplicated. The data team maintained three sets of skills and three governance models. Quarterly board reporting took a week of reconciliation.
The fix was not "pick the best tool." It was "pick the tool that matches the warehouse and the governance goal." Because the group had standardized its data platform on a cloud warehouse and the board demanded one definition of every metric, they consolidated on Looker as the governed semantic layer for cross-region reporting, while keeping Power BI for finance teams already deep in Excel and Microsoft. Tableau stayed in the merchandising team for exploratory analysis, querying the same certified data sources. The lesson: the winning move was defining metrics centrally first, then letting tool choice follow the warehouse and the governance model. This mirrors the maturity path in our guide on building a data-driven organization, and the same data foundation underpins our work on modern data platforms for AI-driven organizations.
A platform decision succeeds or fails in the rollout. Treat it as a program, not a procurement event. Here is a pragmatic four-phase plan.
The expensive errors are rarely technical. They are organizational and they repeat across companies.
The license fee is the visible tip of total cost of ownership. Price the whole iceberg over three years.
A defensible TCO model includes all five categories. A model that only compares sticker prices will mislead you, usually by making the in-database options look cheaper than they are.
For the overwhelming majority of enterprises, the answer is buy. Power BI, Looker, and Tableau represent thousands of engineering years of work in query optimization, connectors, governance, and visualization. Rebuilding that to a competitive standard is not a project; it is a permanent product team you did not plan for.
Building makes sense only in narrow cases: when analytics is your actual product and a differentiator, when you need control over the rendering and interaction layer that no vendor offers, or when data residency and regulatory constraints rule out the commercial options. Even then, most teams build the embedded experience on top of an open-source visualization library and a governed semantic layer (for example dbt or a metrics layer), rather than rebuilding the engine from scratch.
The pragmatic middle path is buy the platform, and build the integration, the semantic layer discipline, and the embedded experience around it. This is where an engineering partner earns its keep. Teams like Mind Supernova, a Vietnam-based software engineering partner founded in 2023, help enterprises stand up the data plumbing, model the semantic layer, and build governed embedded analytics on top of a bought platform, working async-first with 4+ hours of daily UK overlap and senior engineers who can start in 5 to 7 days. The decision discipline here echoes our broader analysis in big data architecture in 2026, and the build-vs-buy posture is similar to the one we recommend in how to choose an AI outsourcing partner without getting burned. If you want to pressure-test your build-vs-buy call, schedule a call with our engineering team.
| Option | When it fits | Main risk |
|---|---|---|
| Buy a platform | Almost always; internal and most embedded analytics | License and warehouse cost growth; governance discipline still required |
| Buy + build around it | Custom embedded experience, specific governance or residency needs | Engineering effort to integrate and maintain the semantic layer |
| Build from scratch | Analytics is your differentiating product | Permanent product investment; reinventing mature engines |
Power BI usually has the lowest entry price, especially if you already hold Microsoft 365 licenses. But total cost depends on Premium or Fabric capacity, warehouse compute under DirectQuery, and admin effort. At large scale with a cloud warehouse, the three-year TCO can converge with rivals, so model the whole picture rather than the seat price.
The 2024 Magic Quadrant positions Power BI, Tableau, and Looker as Leaders based on completeness of vision and ability to execute. It signals they are mature, low-risk choices. It does not rank them by market share or tell you which fits your stack, so use it as a shortlist filter, not a final answer.
Looker leads with LookML, a code-defined, version-controlled semantic layer that enforces one metric definition across every report. Power BI offers strong reusable semantic models if you enforce certification discipline. Tableau models data more per workbook by default, so it needs the most process to achieve the same central consistency.
Yes, and many enterprises do, often unintentionally. The risk is metric drift and triplicated cost. If you run multiple tools, point them at one governed, certified set of data sources or a shared semantic layer so every tool reports the same numbers, and consolidate where you reasonably can.
Looker offers a clean embedded analytics API built for the use case. Power BI Embedded suits products already on Azure with capacity-based pricing. Tableau embeds well visually but needs careful external-user license modeling. Choose based on your existing cloud and the number of external users you will serve.
Power BI, Looker, and Tableau are all Leaders for good reason, and any of them can run a serious enterprise analytics program. The platform that succeeds for you is the one that fits your warehouse, inherits your governance, matches your team's skills, and prices sensibly across three years. The chart gallery is the tie-breaker, never the decision.
This quarter: inventory your metrics, name a governance owner, and score the three platforms against a weighted framework tied to your stack. Next 90 days: run a paid proof of concept on real data, pilot with one team on certified shared models, and model full three-year TCO including warehouse compute and embedded users.
If you want help designing the semantic layer, building governed embedded analytics, or pressure-testing the build-vs-buy decision, talk to our engineering team. We will give you a straight answer about what fits your stack, not a sales pitch.
How to build a real-time data pipeline at enterprise scale: Kafka, Flink, CDC, exactly-once, schema management...

How to build a data-driven organization: a practical BI transformation roadmap across people, process, technol...

A modern data platform for AI is the governed foundation that makes enterprise intelligence possible. Here is...